So many statistics, so little time.
If you have a website and have installed Google Analytics, you'll hopefully have delved a little into the dashboard. You might even have clicked around a little trying to figure out what to look at.
What did you encounter there? An overwhelming wealth of data that boggles the mind!
And if you went a little further and explored Google's help database for understanding what you're looking at?
At that point a lot of people just throw in the towel, throw up their hands, or just throw their computer across the room.
Stay calm. You can get some priceless data from your Analytics, but you need to start with the basics. The key is to focus on just a few reports to start with, based on your main marketing goals.
For example, if you're currently focusing on increasing your traffic from social media, then you'll want to look at the metric that shows you what percentage of visitors are coming from each network.
That said, here are a few of the most important reports and metrics you should get comfortable with from the start:
1. Audience > Overview
This report gives you a snapshot of your visitors and their general interaction with your site.
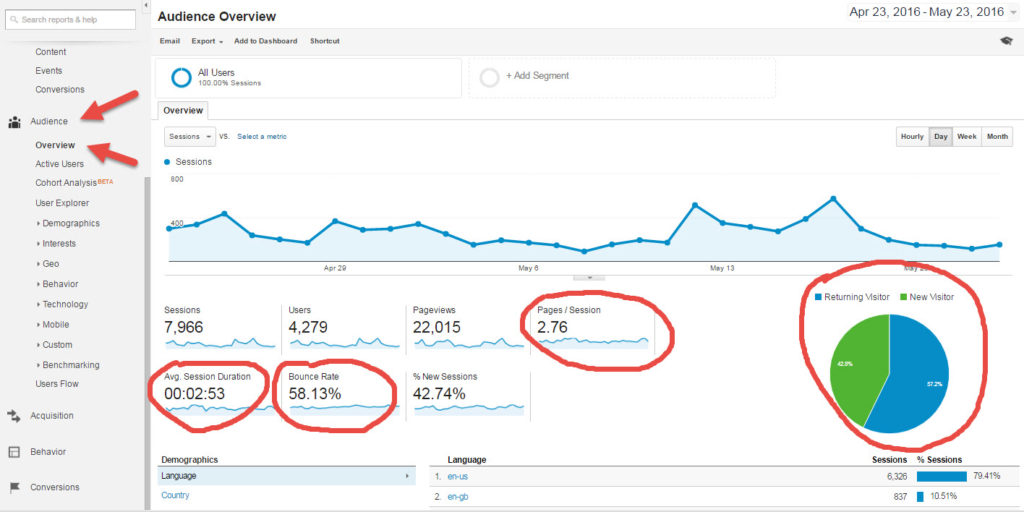
The overview data includes how many pages visitors have viewed per session, how long they spend on your site, how many leave your site right away (bounce rate), and how many are new vs. returning visitors.
Once you have a big picture view of what's going on, you can drill down on the details that concern you – such as a high bounce rate or not enough returning visitors.
2. Acquisition > Overview
This shows you where your visitors are coming from – Directly typed into browser, Email, Search (keywords), Referrals from another site, Social (social media), or Other (more advanced)
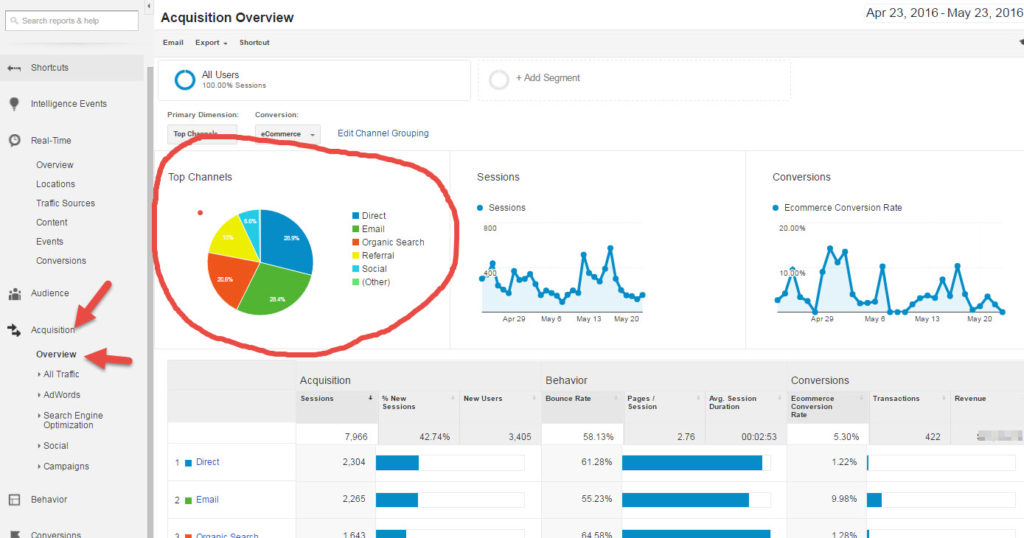
Ideally you want some balance among your sources. One article I read suggested at least 50% from Organic Search traffic.
3. Acquisition > Social
If social media is a big part of your marketing efforts, this data will show you which social networks are providing the best results and which content is driving the most traffic.
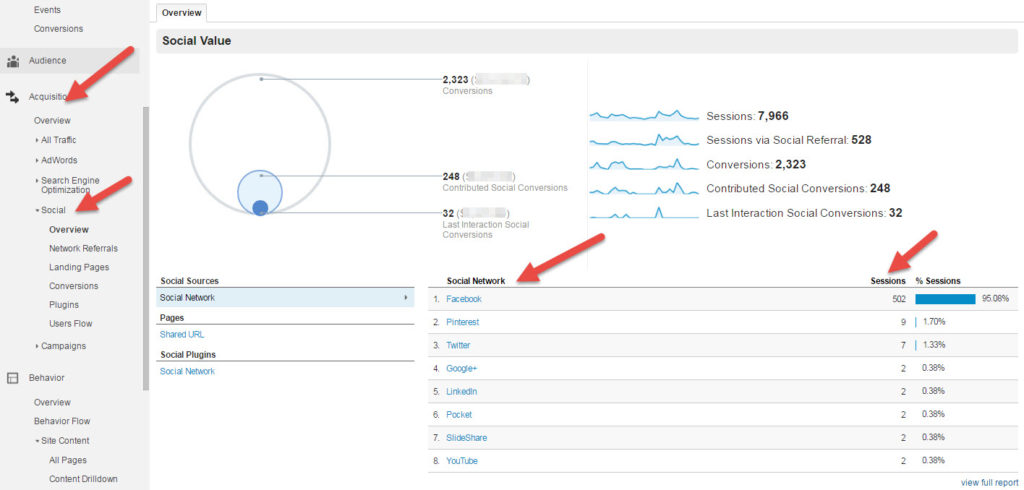
Then you can make decisions on where to focus your social media content efforts moving forward. And you can judge whether those efforts are paying off in traffic and conversions.
4. Behavior > Overview & Site Content
This report shows you which pages on your site are attracting the most visitors, how long they are staying, and how quickly they are leaving your site.
If you drill down to Site Content, you can see the specifics on each of the top pages.
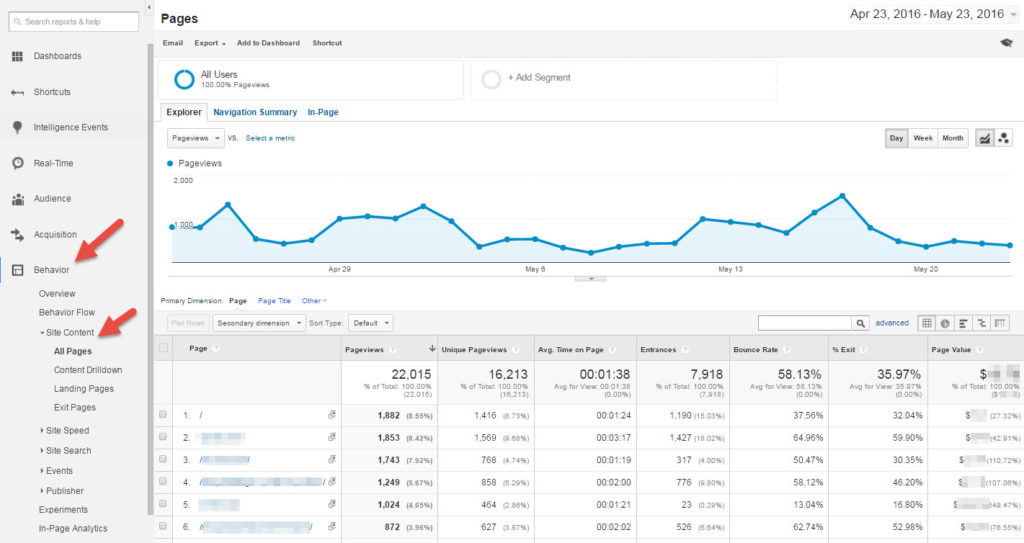
You should especially look at the bounce rate for top landing pages. If a popular page has a high bounce rate, it means people are finding you that way, but you're not providing what they're looking for.
For popular pages with a lower bounce rate, think about what other content you can create that's similar and what's different about these pages vs the high bounce rate ones.
5. Behavior > Site Content > Exit Pages
Along with bounce rate, you want to know which pages people are leaving your site from.
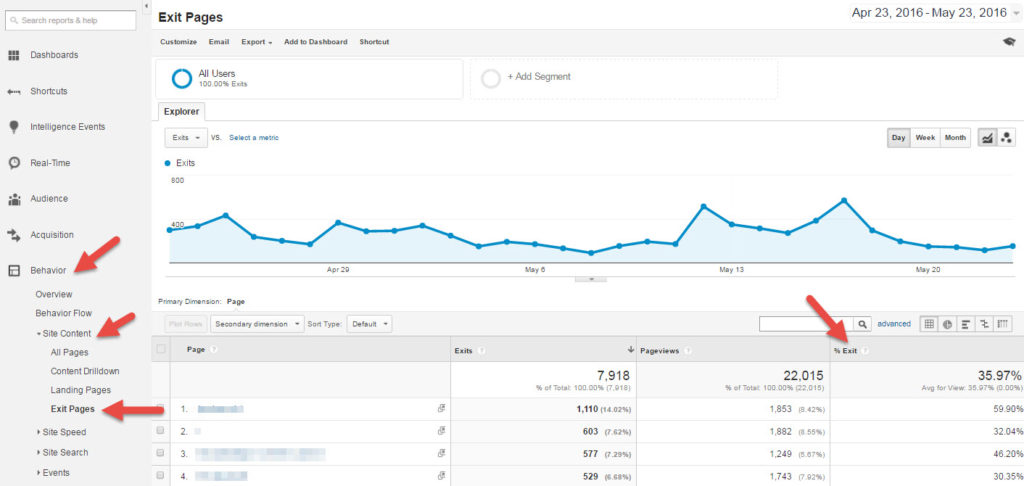
For example, you DO want people to leave a thank-you or order-received page. That's to be expected.
You do NOT want people to leave an opt-in page, shopping cart page, or your home page. If they leave your site from there, then your content needs some re-examination.
6. Conversions > Goals
Beyond these few metrics, you'll also want to set up Goals (and eventually Content Experiments.)
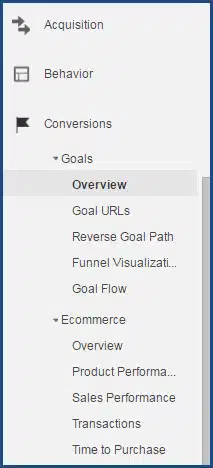
In the Goals section, you can see the actual goal completion percentage for any goals you've set up, along with their value.
Even if you're brand new to Google Analytics, I suggest you try setting up one Goal to get comfortable with this feature.
You'll find the control panel for setting up Goals under Admin > All Web Site Data > Goals.

If you're new to Google Analytics, stick to the basics I just talked about. Then pick out one piece of information and take action on it.
And set a schedule for yourself to review your analytics once a week, or at least once a month depending on what's currently going on in your marketing.
CLICK HERE for Getting Started with Google Analytics>>
Once you get a license for that content, you can edit it, put your own name and brand on, and then share with prospects or sell for 100% profit.
Tags
